 Register
 Log In

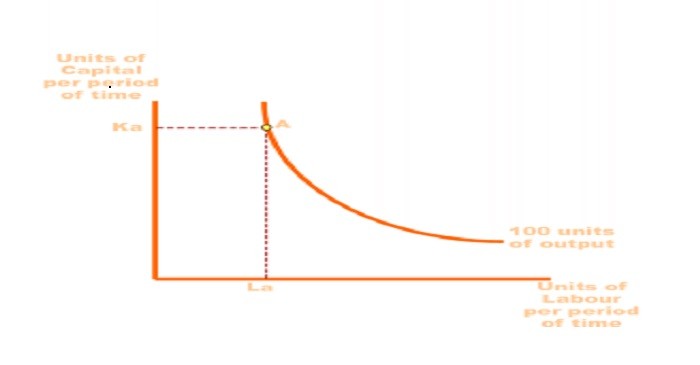
Isoquant
It is the graph used to study financial investment opportunities and the macroeconomy where the inputs produce certain output and the final chart can be used to derive the impact of input on output or production. It is a Latin term used to represent equal quantity but the curve is used to compare to consumer’s response.
The main advantage of using the chart is that it helps to reduce the overall cost of production. It is the curve that can be studied to know the factors associated with commodity production, which can be converted and replaced with other variables to lower the overall cost.